Tutorial 6.2
| Site: | IHE DELFT OPENCOURSEWARE |
| Course: | FAO CB4WA: Google Earth Engine (EN) |
| Book: | Tutorial 6.2 |
| Printed by: | Guest user |
| Date: | Friday, 24 July 2026, 5:37 AM |
Description
This tutorial explains the snippets of script to be developed for first Web Application
1. Introduction
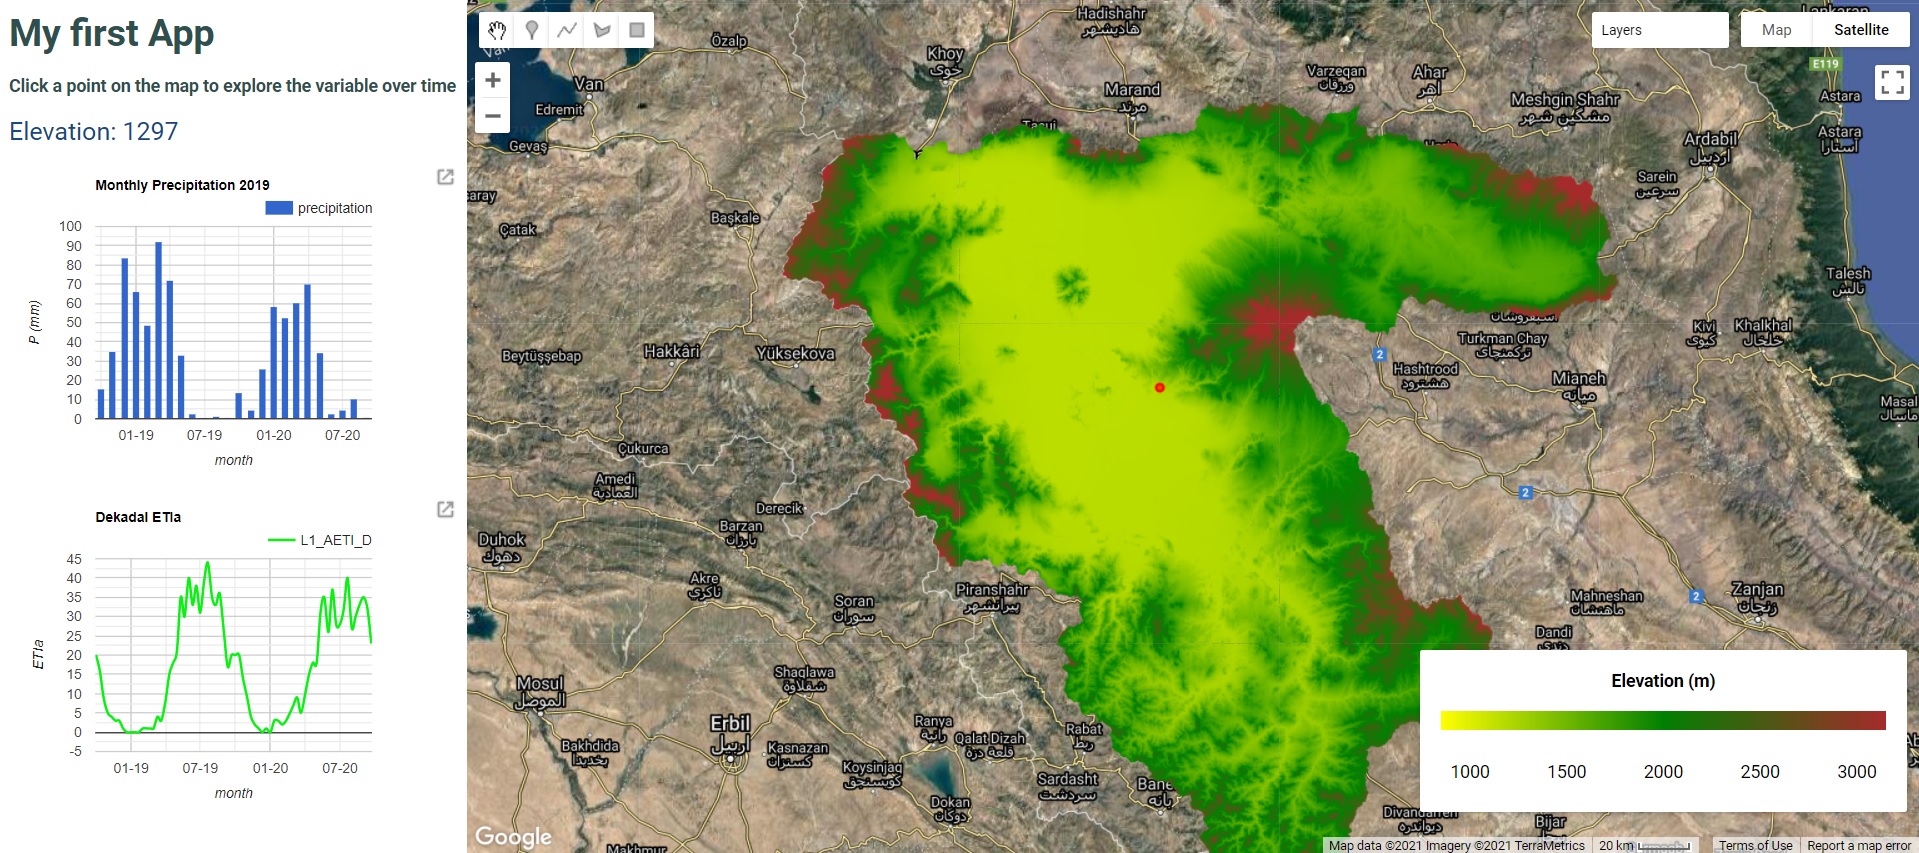
In this tutorial we will develop a script which will be then used to develop a web application with following features:
- Default background of very high resolution satellite data
- Elevation map in the layer list, show the legend of elevation map
- Confine the web app region to a study area (in this case ulb)
- Create a UX panel on the left side to display charts and text
- On click - display charts showing monthly variation of precipitation and ET of that pixel
- On click - display the elevation value of that pixel
- Able to import the chart values to csv
Major building blocks of a web app:
There are three major building blocks for a web application from GEE
- Design - the features and design features we need in our final application
- Scripting - Script using the GEE java script code editor to develop script meeting your requirements
- Deploying - Use the GEE 'Apps' section to deploy your script as an app in Google cloud. A public url based on your user account will be provided which is accessible in public.
2. Script structure
In the following sub chapters - 2.1 to 2.6, the final script used for web application is divided into major sections based on the features for better understanding.
You can create a new empty script in your repository, and copy code snippet from each chapter, run it to see what each code snippet adds in to the overall script and final web application.
2.1. Import data
Below snippet import data from multiple sources. Note the text in green are comments explaining the commands.// Import the following datasets
// First three are public - GPM precipitation data, ALOS Elevation data and WaPOR ET data
// The fourth data is study area boundary which shoulld be available in your assets.
var GPM = ee.ImageCollection("NASA/GPM_L3/IMERG_MONTHLY_V06");
var dsm = ee.ImageCollection("JAXA/ALOS/AW3D30/V3_2");
var ETIa = ee.ImageCollection("FAO/WAPOR/2/L1_AETI_D");
var ulb = ee.FeatureCollection("users/spareeth/Module11/urmia_bdry");
2.2. Display properties
Below code snippet set some display settings for the web app.
- Set default background to Satellite
- Define a palette for elevation data
- Center the map at landing page to center of your study area
- Mosaic and clip elevation (dsm) layer to your study area
- Add the elevation layer to the layer list for the final app.
// Below line set the default background map to Google satellite
Map.setOptions('HYBRID');
// Below line set the default cursor style to crosshair (better to pin point pixel)
Map.style().set('cursor', 'crosshair');
// What we are interested is the first band - DSM
// Let us set a palette to visualize this elevation
var elevPalette = ['yellow', 'green', 'Brown'];
var elev = {min: 1000, max: 3000, palette: elevPalette};
// But we are only interested to see our study area
// See above that the ULB boundary is aleady imported above as variable 'ulb'
Map.centerObject(ulb,8);
//Now let us select the first band 'DSM' and mosaic & clip the DSM to ULB boundary
var dsm_ulb = dsm.select('DSM').filterBounds(ulb).mosaic().clip(ulb);
print(dsm_ulb);
// The below command will add clipped DSM to the map view
Map.addLayer(dsm_ulb, elev, 'Elevation (ALOS)');
2.3. Functions defined
Below code snippet define two functions
- To get number of days in a month
- To convert mm/hour to mm/month
//////FUNCTIONS DEFINED////////
//below function return number of days in a month
function getDaysInMonth(y,m) {
var dt = ee.Date.fromYMD(y,m,1);
var n = dt.advance(1,"month").difference(dt,'day');
return n;
}
//below function will convert mm/hr to mm/month for the
// GPM data
var monthly = function(image) {
var dt = ee.Date(image.get("system:time_end"));
var y = dt.get('year');
var m = dt.get('month');
var days = getDaysInMonth(y,m);
return image.multiply(days).multiply(24).copyProperties(image, ["system:time_start", "system:time_end"]);
};
//////FUNCTIONS DEFINED END HERE////////
2.4. Filter Image collections
Below code snippet filter the image collections (GPM and WaPOR AETI) to two years from October 2018 to September 2020
Further the image collections are refined to the bounding box of study area (ulb)
// select the band with precipitation information
// Filter to 2 years from October 2018 to September 2020 (2 years)
var pcp = GPM.filterDate('2018-10-01', '2020-09-30')
.filterBounds(ulb)
.select('precipitation');
// Apply the monthly function to image collection 'pcp' to
// convert mm/hr to mm/month
var pcp_monthly = pcp.map(monthly);
// Filter ETIa to ulb
// Filter to 2 years from October 2018 to September 2020 (2 years)
var ETIa_filt = ETIa.filterDate('2018-10-01', '2020-09-30')
.filterBounds(ulb);
2.5. Add Legend of elevation
Below code snippet define a function to add a legend for elevation map (ALOS) on the bottom right of map vies of the final web application.
//////////////////Add Legend function STARTS here///////////////////////
// For the web application, to display the legend of elevation
// Below function create a legend as a thumbnail inserted to UI (user interface) panel
function makeLegend(elev) {
var lon = ee.Image.pixelLonLat().select('longitude');
var gradient = lon.multiply((elev.max-elev.min)/100.0).add(elev.min);
var legendImage = gradient.visualize(elev);
var panel = ui.Panel({
layout: ui.Panel.Layout.flow('horizontal'),
style: {
position: 'bottom-right',
padding: '5x 5px',
color: '000000'
},
widgets: [
ui.Label(String(elev.min)),
ui.Label({style: {stretch: 'horizontal'}}),
ui.Label(String(1500)),
ui.Label({style: {stretch: 'horizontal'}}),
ui.Label(String(2000)),
ui.Label({style: {stretch: 'horizontal'}}),
ui.Label(String(2500)),
ui.Label({style: {stretch: 'horizontal'}}),
ui.Label(elev.max)
]
});
// Create legend title //
var legendTitle = ui.Label({
value: 'Elevation (m)',
style: {
stretch: 'horizontal',
textAlign: 'center',
fontWeight: 'bold',
fontSize: '14px',
}
});
var thumb = ui.Thumbnail({
image: legendImage,
params: {bbox:'0,10,100,8', dimensions:'356x15'},
style: {padding: '0.5px'}
});
return ui.Panel({style:{position: 'bottom-right'}}).add(legendTitle).add(thumb).add(panel);
}
Map.add(makeLegend(elev));
//////////////////Add Legend function ENDS here///////////////////////
2.6. Add Panel for displaying charts
Below code snippet add panel in left side of the web application to display some text, and on click results like values and charts.
// Now For the web application we want to create a left panel which will display
// time series plots on click on map inside ulb
// Let us create two charts i) monthly precipitation and ii) dekadal ETIa of two years
// Also display elevation value on click on a pixel
///////////////////Insert Panels to display charts and results ///////////////
// Create an empty panel and let us add the remaining panels as sub panels to this one
var panel = ui.Panel({
style: {fontSize: '20px', color: '114982'}
});
// Create a panel to display some labels like text
var text = ui.Panel([
ui.Label({
value: 'My first App',
style: {fontSize: '30px', fontWeight: 'bold', color: '#2F4F4F'}
}),
ui.Label({
value:'Click a point on the map to explore the variable over time',
style: {fontSize: '14px', fontWeight: 'bold', maxWidth: '400px', color: '#2F4F4F'}
}),
]);
// Add the new text panel to the root panel.
panel.add(text);
// Create a panel to display elevation value on click
var inspector = ui.Panel([ui.Label('Click to get Elevation')]);
panel.add(inspector);
// Below we are going to define panels to display dynamic objects -
// Elevation values, precipitation chart, ETIa chart
Map.onClick(function(coords) {
// Add a chart to put monthly precipitation chart
var point = ee.Geometry.Point(coords.lon, coords.lat);
var dot = ui.Map.Layer(point, {color: 'FF0000'});
Map.layers().set(1, dot);
var sample = dsm_ulb.sample(point, 30);
var computedValue = sample.first().get('DSM');
// Request the value from the server.
computedValue.evaluate(function(result) {
// When the server returns the value, show it.
inspector.widgets().set(0, ui.Label({
value: 'Elevation: ' + result,
}));
});
var chart1 = ui.Chart.image.series({
imageCollection: pcp_monthly.select(['precipitation']),
region: point,
reducer: ee.Reducer.mean(),
scale: 30
});
chart1.setOptions({
title: 'Monthly Precipitation 2019',
vAxis: {title: 'P (mm)', gridlines: {count: 10}},
hAxis: {title: 'month', format: 'MM-yy', gridlines: {count: 10}},
label: 'ETa',
width: 250,
height: 250,
//interpolateNulls: true,
//curveType: 'function'
});
chart1.setChartType('ColumnChart');
panel.widgets().set(2, chart1);
//////Second chart
var chart2 = ui.Chart.image.series({
imageCollection: ETIa_filt.select('L1_AETI_D'),
region: point,
reducer: ee.Reducer.mean(),
scale: 250
});
chart2.setOptions({
title: 'Dekadal ETIa',
vAxis: {title: 'ETIa', gridlines: {count: 10}, maxValue: 0.5, minValue: 0 },
hAxis: {title: 'month', format: 'MM-yy', gridlines: {count: 10}},
width: 250,
height: 250,
colors: ['#09F310'],
interpolateNulls: true,
curveType: 'function'
});
panel.widgets().set(3, chart2);
});
// Add the above defined panel to root
ui.root.insert(0, panel);
3. Final Script
Below code is the entire script which you can save as a new script in your GEE java script editor and save. Once saved you can follow the tutorial video of exercise 6.1, to develop a web application from this script.
Note that you have to edit line 7 to adapt the script to your study area or the ulb asset in your reposiroty.
// Import the following datasets
// First three are public - GPM precipitation data, ALOS Elevation data and WaPOR ET data
// The fourth data is study area boundary which shoulld be available in your assets.
var GPM = ee.ImageCollection("NASA/GPM_L3/IMERG_MONTHLY_V06");
var dsm = ee.ImageCollection("JAXA/ALOS/AW3D30/V3_2");
var ETIa = ee.ImageCollection("FAO/WAPOR/2/L1_AETI_D");
var ulb = ee.FeatureCollection("users/spareeth/Module11/urmia_bdry");
// Below line set the default background map to Google satellite
Map.setOptions('HYBRID');
// Below line set the default cursor style to crosshair (better to pin point pixel)
Map.style().set('cursor', 'crosshair');
// What we are interested is the first band - DSM
// Let us set a palette to visualize this elevation
var elevPalette = ['yellow', 'green', 'Brown'];
var elev = {min: 1000, max: 3000, palette: elevPalette};
// But we are only interested to see our study area
// See above that the ULB boundary is aleady imported above as variable 'ulb'
Map.centerObject(ulb,8);
//Now let us select the first band 'DSM' and mosaic & clip the DSM to ULB boundary
var dsm_ulb = dsm.select('DSM').filterBounds(ulb).mosaic().clip(ulb);
print(dsm_ulb);
// The below command will add clipped DSM to the map view
Map.addLayer(dsm_ulb, elev, 'Elevation (ALOS)');
//////FUNCTIONS DEFINED////////
//below function return number of days in a month
function getDaysInMonth(y,m) {
var dt = ee.Date.fromYMD(y,m,1);
var n = dt.advance(1,"month").difference(dt,'day');
return n;
}
//below function will convert mm/hr to mm/month for the
// GPM data
var monthly = function(image) {
var dt = ee.Date(image.get("system:time_end"));
var y = dt.get('year');
var m = dt.get('month');
var days = getDaysInMonth(y,m);
return image.multiply(days).multiply(24).copyProperties(image, ["system:time_start", "system:time_end"]);
};
//////FUNCTIONS DEFINED END HERE////////
// select the band with precipitation information
// Filter to 2 years from October 2018 to September 2020 (2 years)
var pcp = GPM.filterDate('2018-10-01', '2020-09-30')
.filterBounds(ulb)
.select('precipitation');
// Apply the monthly function to image collection 'pcp' to
// convert mm/hr to mm/month
var pcp_monthly = pcp.map(monthly);
// Filter ETIa to ulb
// Filter to 2 years from October 2018 to September 2020 (2 years)
var ETIa_filt = ETIa.filterDate('2018-10-01', '2020-09-30')
.filterBounds(ulb);
print(ETIa_filt.size());
//////////////////Add Legend function STARTS here///////////////////////
// For the web application, to display the legend of elevation
// Below function create a legend as a thumbnail inserted to UI (user interface) panel
function makeLegend(elev) {
var lon = ee.Image.pixelLonLat().select('longitude');
var gradient = lon.multiply((elev.max-elev.min)/100.0).add(elev.min);
var legendImage = gradient.visualize(elev);
var panel = ui.Panel({
layout: ui.Panel.Layout.flow('horizontal'),
style: {
position: 'bottom-right',
padding: '5x 5px',
color: '000000'
},
widgets: [
ui.Label(String(elev.min)),
ui.Label({style: {stretch: 'horizontal'}}),
ui.Label(String(1500)),
ui.Label({style: {stretch: 'horizontal'}}),
ui.Label(String(2000)),
ui.Label({style: {stretch: 'horizontal'}}),
ui.Label(String(2500)),
ui.Label({style: {stretch: 'horizontal'}}),
ui.Label(elev.max)
]
});
// Create legend title //
var legendTitle = ui.Label({
value: 'Elevation (m)',
style: {
stretch: 'horizontal',
textAlign: 'center',
fontWeight: 'bold',
fontSize: '14px',
}
});
var thumb = ui.Thumbnail({
image: legendImage,
params: {bbox:'0,10,100,8', dimensions:'356x15'},
style: {padding: '0.5px'}
});
return ui.Panel({style:{position: 'bottom-right'}}).add(legendTitle).add(thumb).add(panel);
}
Map.add(makeLegend(elev));
//////////////////Add Legend function ENDS here///////////////////////
// Now For the web application we want to create a left panel which will display
// time series plots on click on map inside ulb
// Let us create two charts i) monthly precipitation and ii) dekadal ETIa of two years
// Also display elevation value on click on a pixel
///////////////////Insert Panels to display charts and results ///////////////
// Create an empty panel and let us add the remaining panels as sub panels to this one
var panel = ui.Panel({
style: {fontSize: '20px', color: '114982'}
});
// Create a panel to display some labels like text
var text = ui.Panel([
ui.Label({
value: 'My first App',
style: {fontSize: '30px', fontWeight: 'bold', color: '#2F4F4F'}
}),
ui.Label({
value:'Click a point on the map to explore the variable over time',
style: {fontSize: '14px', fontWeight: 'bold', maxWidth: '400px', color: '#2F4F4F'}
}),
]);
// Add the new text panel to the root panel.
panel.add(text);
// Create a panel to display elevation value on click
var inspector = ui.Panel([ui.Label('Click to get Elevation')]);
panel.add(inspector);
// Below we are going to define panels to display dynamic objects -
// Elevation values, precipitation chart, ETIa chart
Map.onClick(function(coords) {
// Add a chart to put monthly precipitation chart
var point = ee.Geometry.Point(coords.lon, coords.lat);
var dot = ui.Map.Layer(point, {color: 'FF0000'});
Map.layers().set(1, dot);
var sample = dsm_ulb.sample(point, 30);
var computedValue = sample.first().get('DSM');
// Request the value from the server.
computedValue.evaluate(function(result) {
// When the server returns the value, show it.
inspector.widgets().set(0, ui.Label({
value: 'Elevation: ' + result,
}));
});
var chart1 = ui.Chart.image.series({
imageCollection: pcp_monthly.select(['precipitation']),
region: point,
reducer: ee.Reducer.mean(),
scale: 30
});
chart1.setOptions({
title: 'Monthly Precipitation 2019',
vAxis: {title: 'P (mm)', gridlines: {count: 10}},
hAxis: {title: 'month', format: 'MM-yy', gridlines: {count: 10}},
label: 'ETa',
width: 250,
height: 250,
//interpolateNulls: true,
//curveType: 'function'
});
chart1.setChartType('ColumnChart');
panel.widgets().set(2, chart1);
//////Second chart
var chart2 = ui.Chart.image.series({
imageCollection: ETIa_filt.select('L1_AETI_D'),
region: point,
reducer: ee.Reducer.mean(),
scale: 250
});
chart2.setOptions({
title: 'Dekadal ETIa',
vAxis: {title: 'ETIa', gridlines: {count: 10}, maxValue: 0.5, minValue: 0 },
hAxis: {title: 'month', format: 'MM-yy', gridlines: {count: 10}},
width: 250,
height: 250,
colors: ['#09F310'],
interpolateNulls: true,
curveType: 'function'
});
panel.widgets().set(3, chart2);
});
// Add the above defined panel to root
ui.root.insert(0, panel);