Tutorial Cartography for Map Figures in Academic Journals & Books
This workshop will discuss approaches and guidelines for creating map figures for academic books and journals. I will use QGIS to illustrate one workflow in a graphical GIS. This general workflow can be applied to other graphical GIS programs or even non-map figures.
This workshop was developed by Dr. Michele Tobias from UC Davis (GPL 3.0 license) and updated to QGIS 3.22 with some minor changes by Dr. Hans van der Kwast, published on GISopencourseware. The original workshop can be found here.
3. Hands On
3.4. Setting Up Your Map Project: Assemble all the data
Open QGIS Desktop and start a new project.
Load in the data in QGIS - Lake Monsters, Lakes, Admin 1 boundaries (states). All of the data we're working with today is vector data.
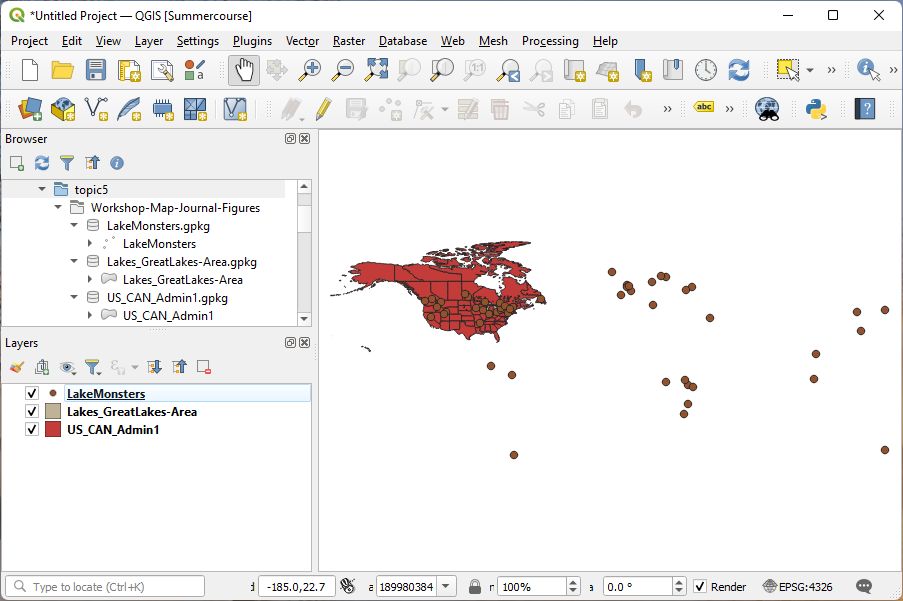
Save your project file.
Set your project's projection to North America Albers Equal Area Conic (ESRI: 102008). I'm using the first transformation it offers me because that one is most appropriate for the area we'll be mapping today.
Save the project again.