Tutorial 4: NetCDF in QGIS
In this tutorial you'll learn to use QGIS to read and visualise NetCDF data as raster or mesh layers. The data for this tutorial can be accessed here
2. Load raster layers from NetCDF
In this chapter, we're going to load NetCDF layers as rasters into QGIS.
1. Start QGIS Desktop.
2. In the Browser panel, locate et_look_out.nc and expand the contents by clicking the arrow.

You can see that the NetCDF file has the ![]() icon that indicates that it contains layers.
icon that indicates that it contains layers. ![]() indicates raster layers, while
indicates raster layers, while ![]() is used for mesh layers. In this chapter we'll focus on the raster layers.
is used for mesh layers. In this chapter we'll focus on the raster layers.
3. Select the et_24_mm raster layer and drag it to the map canvas. Note: et_24_mm is the variable name in an old version of pywapor. If you are using pywapor version 3.5.17 onwards, the variable name is aeti_24_mm.
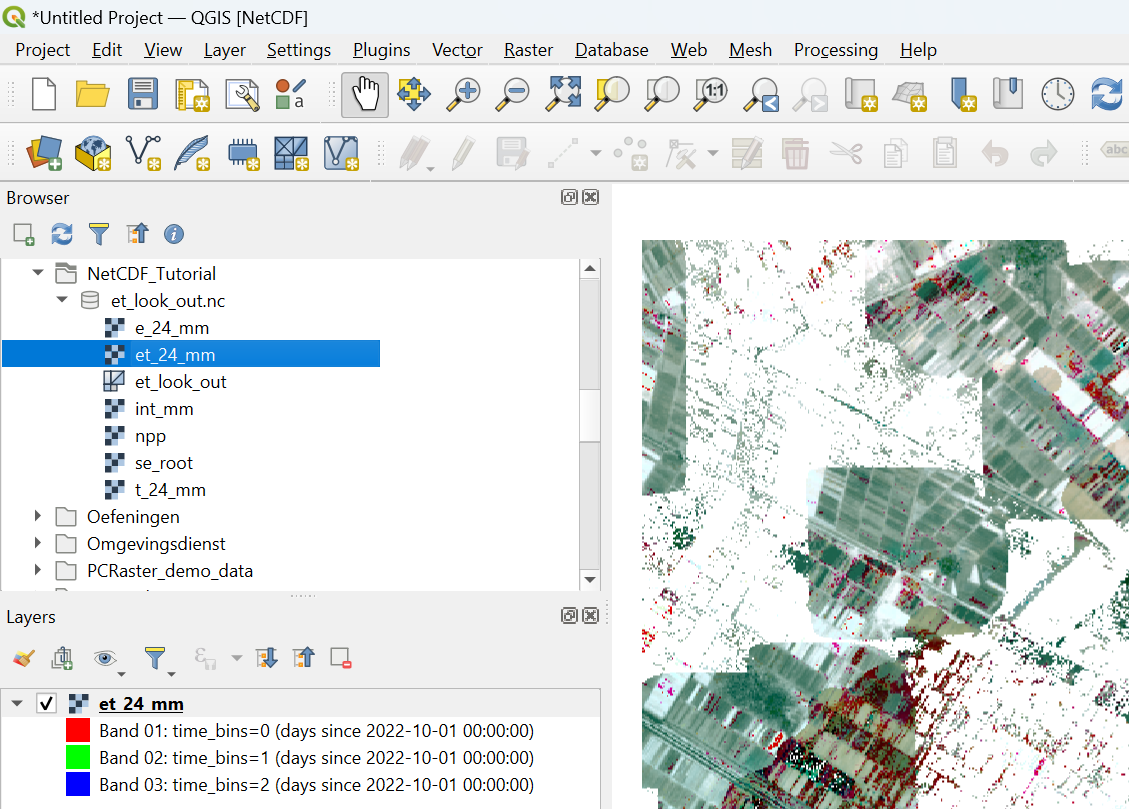
Because the raster layer contains a layer for every day in the dekad, it is by default visualised as a multiband raster. If there's data in the first three bands it will be visible as a composite. This is not very useful for this type of information. Let's change that.
4. In the Layers panel, click ![]() to open the Layer Styling panel.
to open the Layer Styling panel.
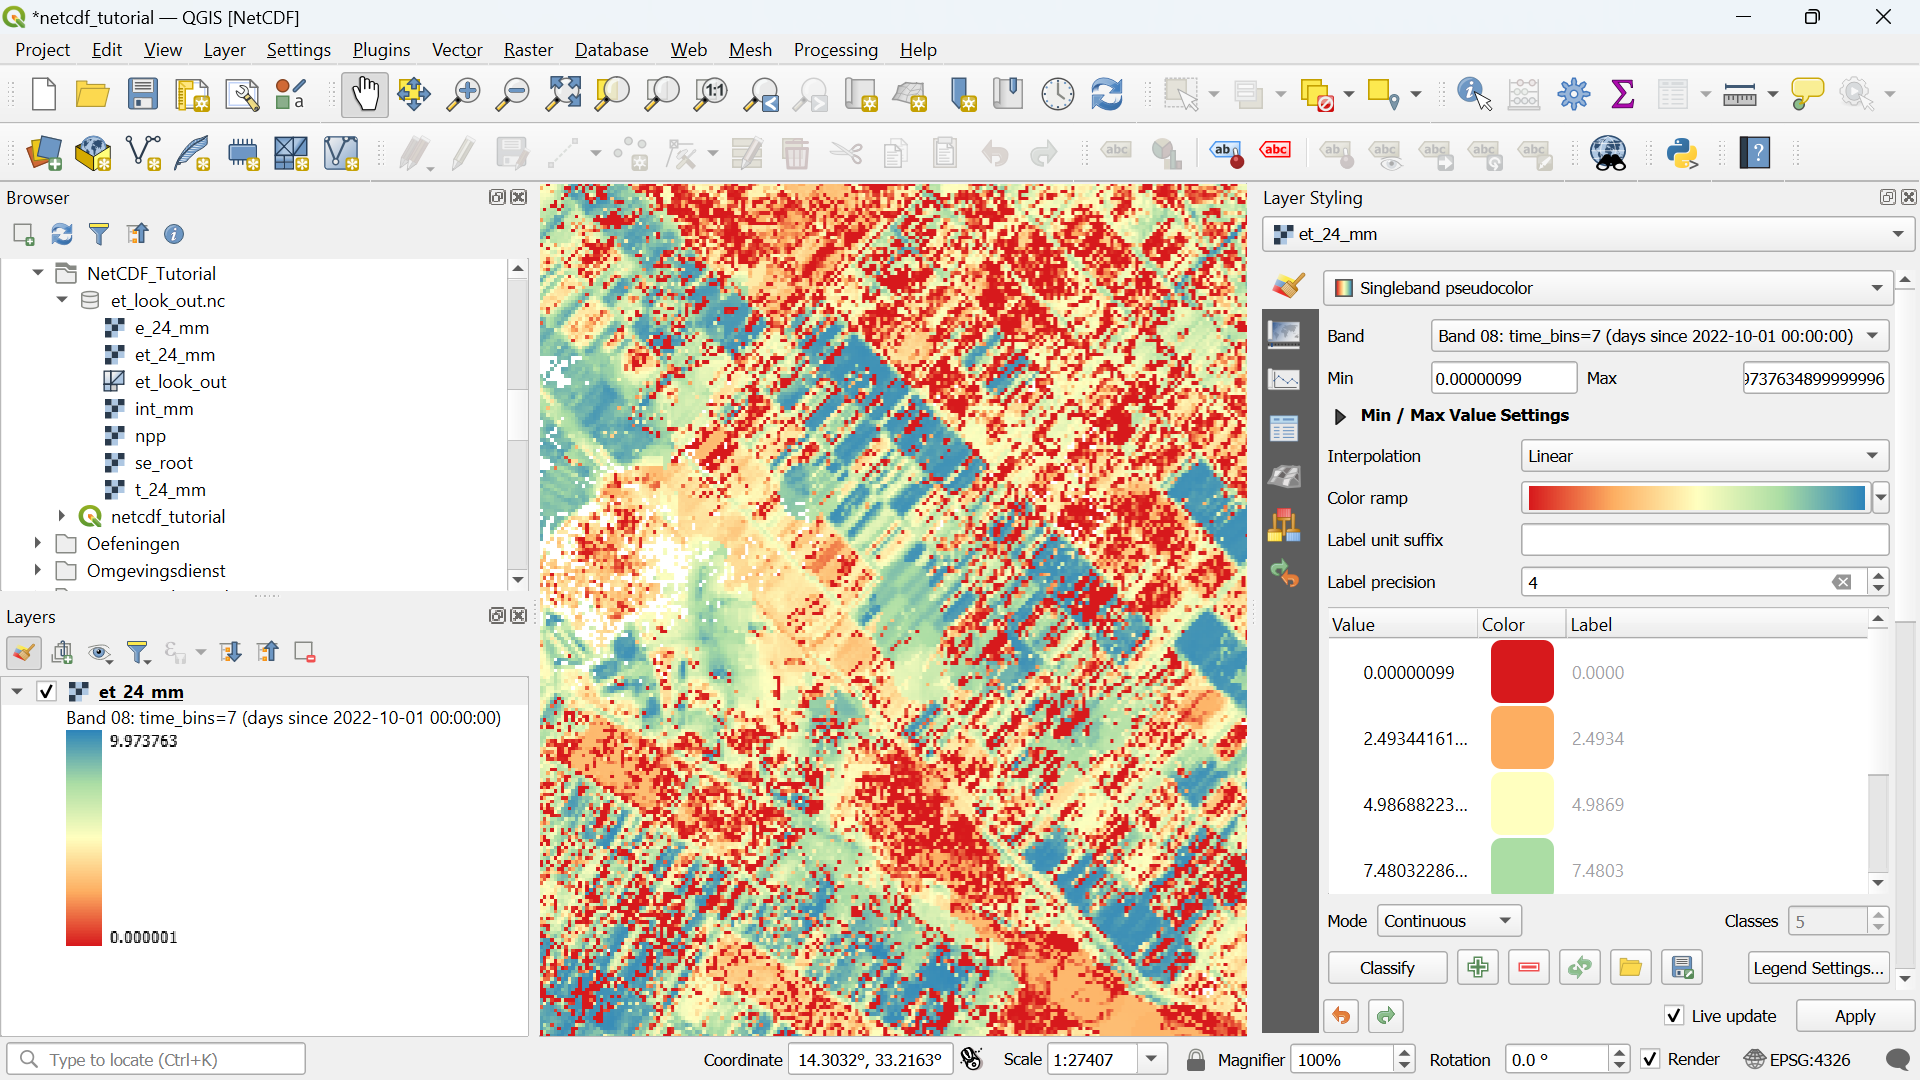
5. In the Layer Styling panel, change the renderer from Multiband color to Singleband pseudocolor.
6. At Band, use the drop-down menu to choose a time step with data, e.g. Band 50.
7. Finally, choose a Color ramp to visualise the evapotranspiration of the chosen date.

In this way, we can visualise ET for a specific day of the dekad.
In a similar way you can load and visualise the other raster layers in the NetCDF file.