PyWaPOR OpenCourseWare
Résumé de section
-
Welcome
-
-
To perform analyses on the pyWaPOR outputs you can review the python scripts of the MOOC 'Python for geospatial analyses'. It includes zonal statistics using shapefiles (Notebook 5) which allows for generating statistics for individual fields or areas with similar crop types. For analysing per crop type (using a raster file) instructions are provided below.
-
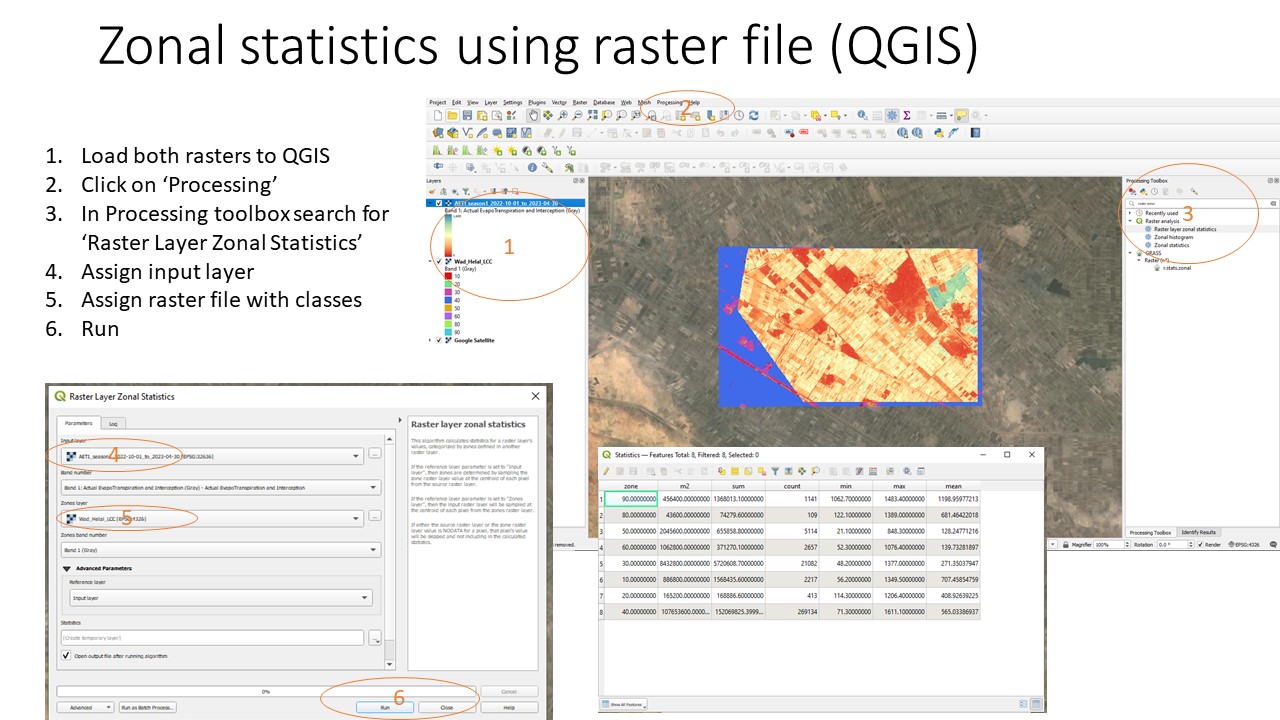
Zonal statistics (using raster crop map)
-
Masking croplands
With this python script you can mask cropped areas using mean NDVI threshold (set at 0.3) for Sentinel images for a set period (best to select period during the peak growing season.
This script is based on this Google Earth Engine exercise to find irrigated area (using NDVI) (part of GEE course):
https://courses.gisopencourseware.org/mod/page/view.php?id=717
-
Plot ETa/NDVI/Biomass time series per landcover class
-
This video explains the aggregation of the dekadal data into monthly data
-
This video explains how to create time series of average ETa per land cover class
-